


BASIC GUIDE TO UNDERSTANDING AN AUDIOGRAM
Liz Kobylak, HLAA-MI Hearing Technology Resource Specialist
Those of us who have been diagnosed with hearing loss have probably, at some point, looked with dread at our audiograms which graph our hearing test results. This graph can be confusing to those just beginning their hearing loss journey. To understand the basics of how to read an audiogram we need to become familiar with a few terms related to hearing loss.
Air Conduction: hearing test signal (tones or speech) through the headphones.
Bone Conduction: hearing test signal (tones or speech) through a vibrating tool called the oscillator placed on the mastoid bone behind the ear.
Decibel (dB): unit of measurement for sound. This is a logarithmic measurement, not a linear one.
Frequency: pitch or tone, measured in Hertz (Hz).
Masking: a noise signal used to keep one ear “busy” while testing the other ear.
Threshhold: the softest level of a puretone to which a person responds 50% of the time.
Speech Reception Threshhold: the softest level at which a person correctly repeats two-syllable words 50% of the time.
Speech Discrimination: Testing with words at a comfortable level of loudness to identify problems with speech understanding beyond what is expected for the hearing loss.
Sensorineural loss: hearing loss which occurs in the cochlea (sense organ) or beyond (neural).
Conductive loss: hearing loss with better test results from the oscillator, generally means signal is being blocked in the canal or middle ear.
Mixed loss: hearing loss with a sensorineural and conductive component.
Now let’s take a look and become familiar with the audigram: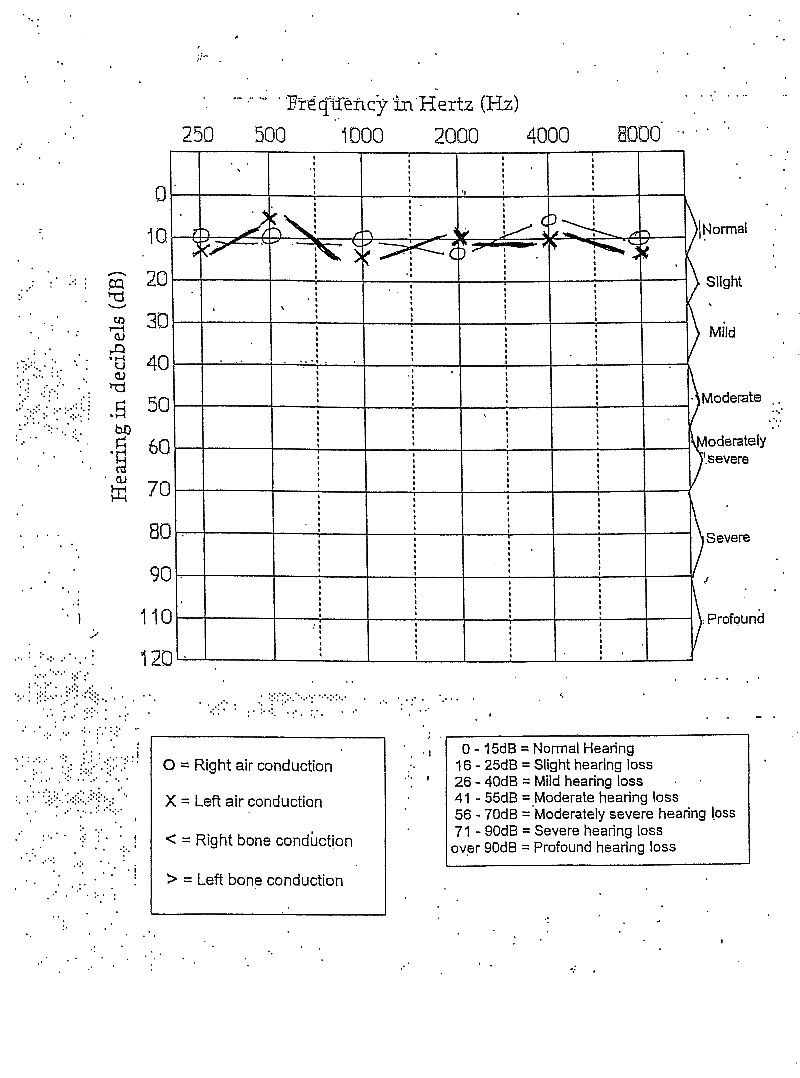
- The numbers along the left side of the chart measure decibels (dB). The higher the number, the louder the sound. This is not a linear scale, it is logarithmic.
- The numbers along the top of the chart measure frequency or pitch of sound in Hertz (Hz). Think of this part as a piano keyboard with the lower pitch sounds on the left of the chart. The sounds become higher in pitch as you move to the right.
- The right side of this chart shows various levels/categories of hearing loss.
- Right ear air conduction threshholds are marked with a “O”
- Left ear air conduction threshholds are marked with an “X”
- The audiologist may mark the threshold results for the Right ear with RED ink and for the Left ear with BLUE ink.
- Right bone conduction results are marked with this “<“
- Left bone conduction results are marked with this “>“